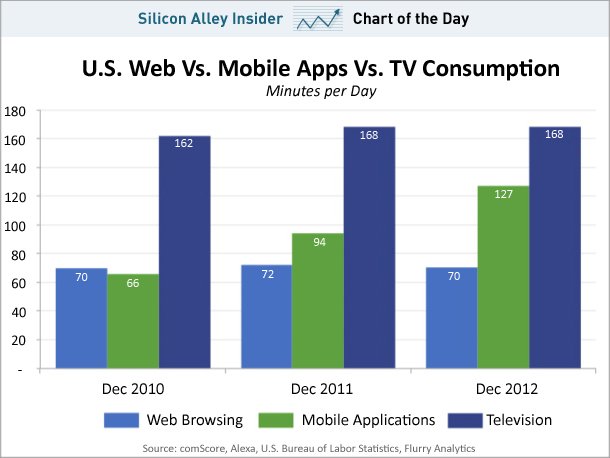
I found this very cool chart today that was posted by Silicon Alley Insider. The chart shows how many minutes per day people are spending with their smartphones vs how much time they spend watching TV.
The chart, from mobile analytics firm, Flurry shows that in 2012, people spent 127 minutes per day with their smartphones which is just short of the 168 minutes per day that they watch TV and as you can see, over the last three years, the number of minutes spent with smartphones is growing while both web browsing on a computer and TV watching has pretty much leveled off for the same time frame.
As you can see from the chart, 2012’s 127 minutes is up from 66 minutes per day in 2010 and it is expected that this trend will steadily grow for several more years before reaching the level off stage.
We are spending more time with mobile phones and apps than we do on the web. This time spent is rapidly approaching the time we spend watching TV.
What does it mean? Well…
It means that you should be spending a large part of your advertising/marketing budgets on mobile marketing. It’s easier to get the attention of potential buyers if your ads are where your market is looking. Make sense?

If you would like to learn how we can help you design a mobile marketing strategy that’s right for your business, call us today.
Mobile Marketing works and we can prove it to you. Give us a call at 843-647-9489
![]()
P.S. Don’t take our word for it, you can read the original article here: https://www.businessinsider.com/chart-of-the-day-web-mobile-tv-consumption-2012-12#ixzz2EwQFsB4f


Speak Your Mind